
V6.1: Refining the Dual Allocator with Better Data and a TLT Guardrail
Part 59 — Iterating on the core strategy with adjusted prices, transaction costs, and rate-shock protection

This is part 59 of my series — Building & Scaling Algorithmic Trading Strategies
This post covers the latest iteration of the Dual Allocator — V6.1. I went through the codebase and data pipeline, fixed a few issues, and added a guardrail for rate-shock scenarios. The result is a cleaner implementation with more realistic performance expectations.
1. What Changed in V6.1
Three main updates:
Adjusted close prices — Now using dividend/split-adjusted data for proper total return calculation
Transaction costs — Added 0.05% cost per position change
TLT momentum guardrail — Checks TLT’s own trend before allocating 100% during high VIX
2. Data Quality Fixes
Adjusted Prices
The original implementation used raw Close/Last prices. V6.1 uses adjusted closes, which captures dividends and splits. QQQ pays ~0.5-1% annually, so this adds up over 16 years.
Missing Data Handling
Previously, missing data defaulted to zero return. V6.1 uses calendar intersection—requiring all assets to have data on a given day before including it in the backtest.
3. The Math Behind the Updates
Adjusted Price Impact
Unadjusted prices miss dividend reinvestment. QQQ’s dividend yield has averaged ~0.5-0.7% annually. Over 16 years, this compounds:
Unadjusted final value:  P_0 × (1 + r)^16
Adjusted final value:    P_0 × (1 + r + d)^16

Where d ≈ 0.006 (0.6% dividend yield)

Example with r = 0.19 (QQQ's ~19% CAGR):
  Unadjusted: (1.19)^16 = 16.17x
  Adjusted:   (1.196)^16 = 17.85x

Difference: ~10.4% higher total return with dividends
TLT’s yield is higher (~2-3% historically), so the adjustment matters more for benchmark comparisons involving bonds.
Transaction Cost Compounding
The 0.05% per-trade cost seems small, but it compounds against you:
Total position changes: 398 over 16 years
Cost per change: 0.05% (covers spread + slippage)

Naive calculation: 398 × 0.0005 = 0.199 = 19.9%

But costs compound multiplicatively:
  Final multiplier = (1 - 0.0005)^398 = 0.819

Effective drag: 1 - 0.819 = 18.1%
This explains most of the return difference between V6.0 (no costs) and V6.1 (with costs). The ~200% total return reduction from 2,644% to 2,442% comes primarily from this drag.
TLT Velocity Calculation
The guardrail uses the same velocity formula as QQQ momentum, applied to TLT:
TLT_velocity = (TLT_MA20[t] - TLT_MA20[t-5]) / TLT_price[t]

If VIX >= 25:
    If TLT_velocity < 0:
        allocation = 0.5  # TLT falling, reduce exposure
    Else:
        allocation = 1.0  # TLT rising, full allocation
The 5-day lookback on a 20-day MA creates a smoothed momentum signal that filters out daily noise while still responding to trend changes within 1-2 weeks.
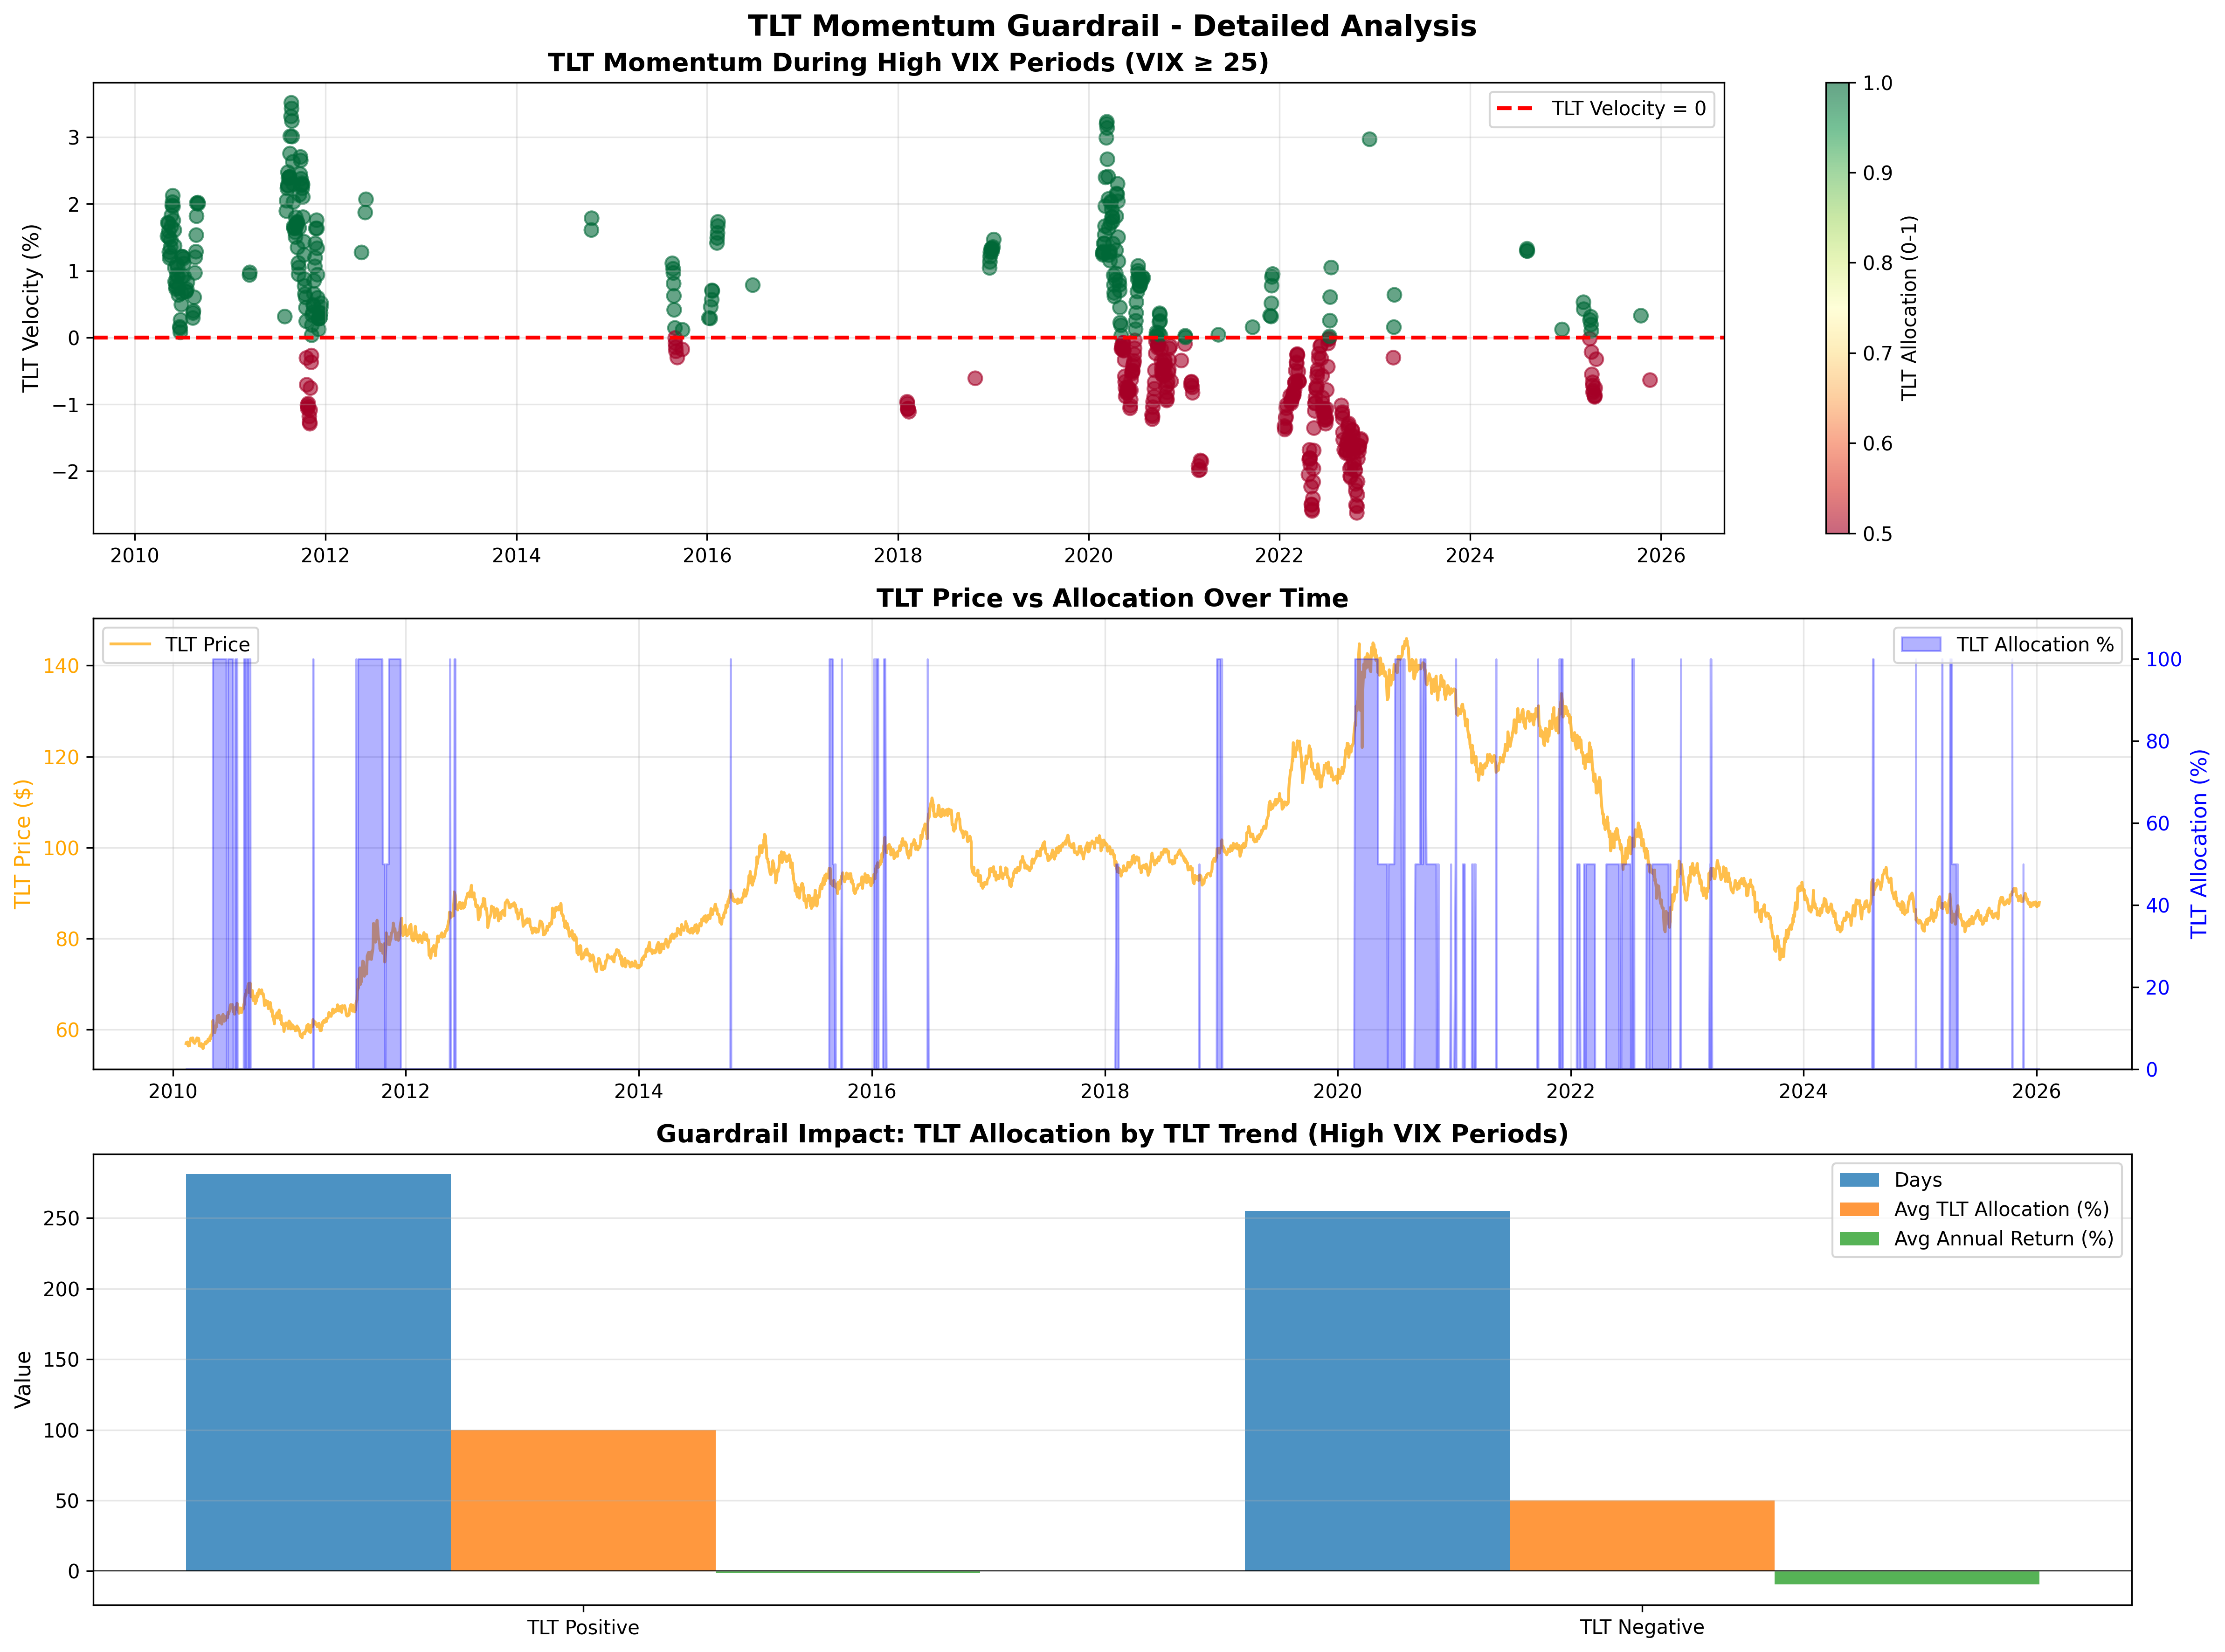
In the 2022 rate shock, TLT’s 20-day MA was falling consistently from January through October. The guardrail would have triggered on most high-VIX days during that period, cutting TLT exposure in half.
4. The TLT Guardrail
V6’s defensive logic allocates 100% to TLT when VIX exceeds 25. This works well in flight-to-safety scenarios (2008, 2020) where bonds rally as equities fall.
The gap: in 2022-style rate shocks, VIX spiked while TLT fell 40%+. The original logic would allocate fully to TLT during exactly the wrong conditions.
V6.1 adds a check:
def determine_position(velocity_pct, vix_level, tlt_velocity):
    if vix_level >= 25:
        if tlt_velocity < 0:
            return 'TLT', 0.5  # Partial allocation when TLT falling
        else:
            return 'TLT', 1.0  # Full allocation when TLT rising
    # ... rest unchanged
This reduced max drawdown by about 4 percentage points in backtesting.
5. Performance Comparison
V6.0 vs V6.1
Metric V6.0 Original V6.1 Fixed Change
──────────────────────────────────────────────────────────
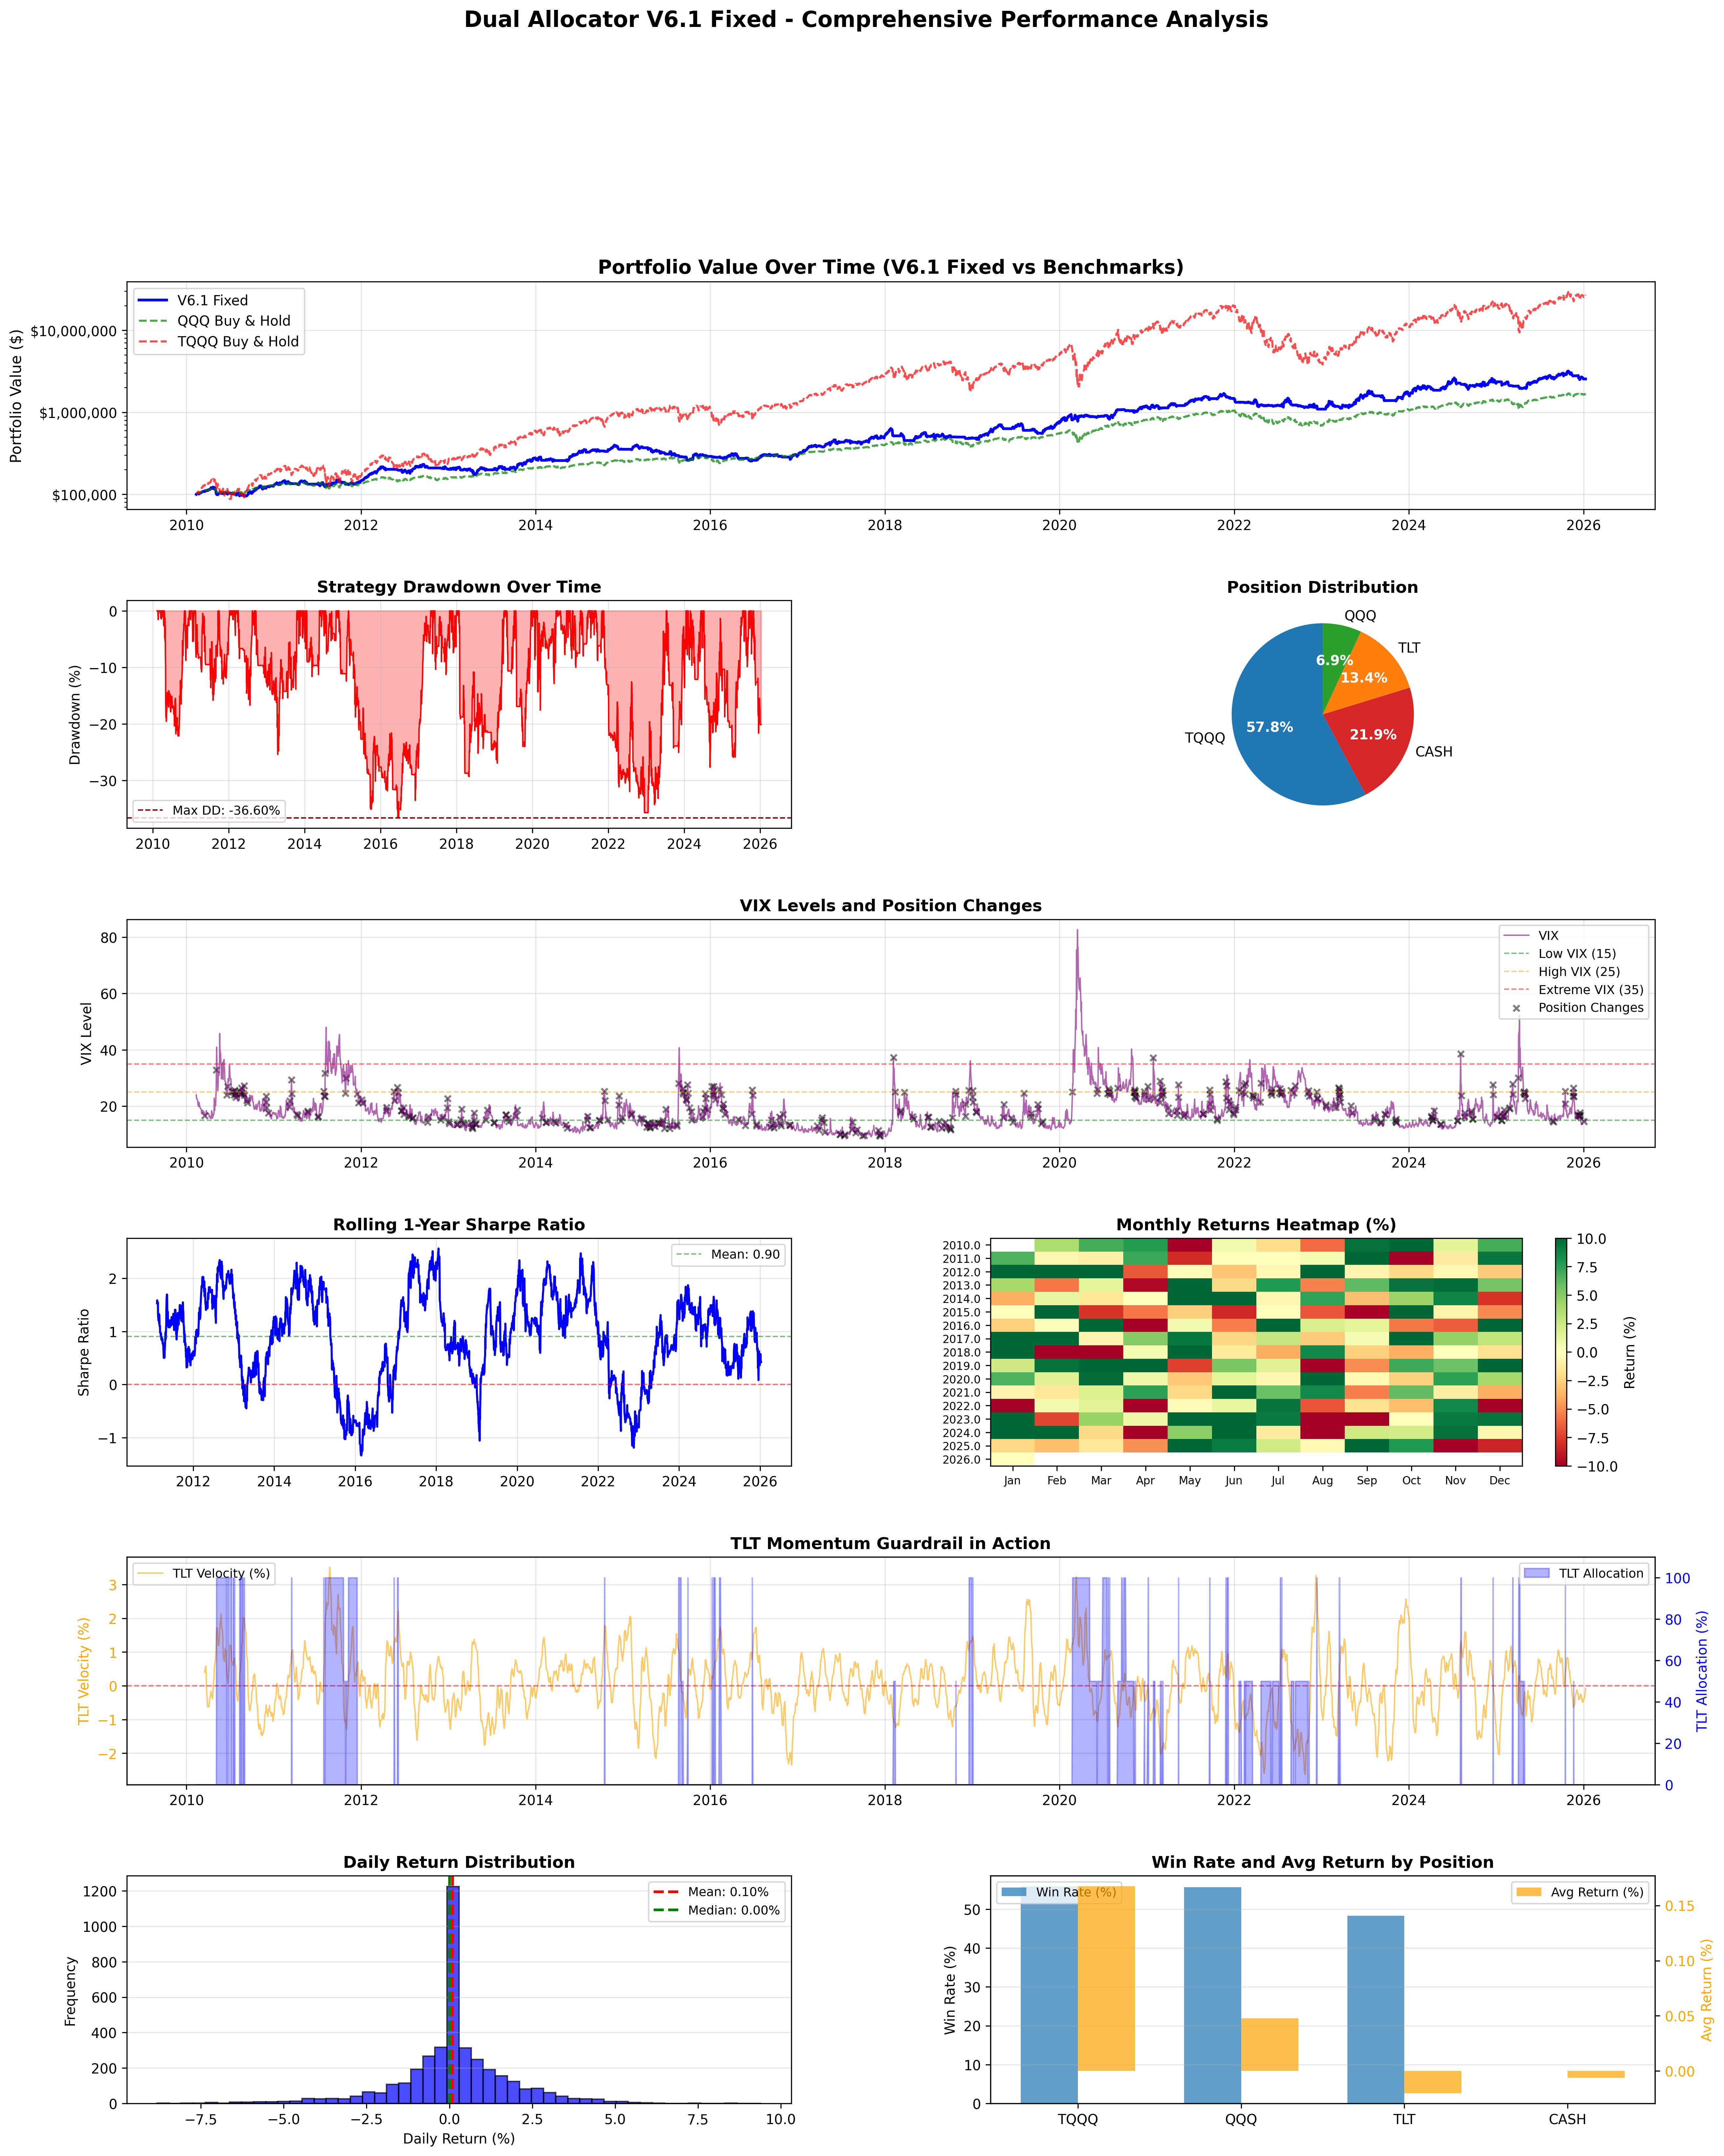
Total Return 2,643.75% 2,442.34% -201%
Sharpe Ratio 0.885 0.874 -0.011
Max Drawdown -40.56% -36.60% +3.96%
Position Changes ~100/yr 398 total
Transaction Costs $0 0.05%/tradeThe return reduction comes primarily from transaction costs (~20% drag over 16 years) and the TLT guardrail occasionally missing bond rallies. The drawdown improvement comes from the guardrail working as intended during rate-sensitive periods.
V6.1 vs Benchmarks
Metric V6.1 Fixed QQQ B&H TQQQ B&H
───────────────────────────────────────────────────
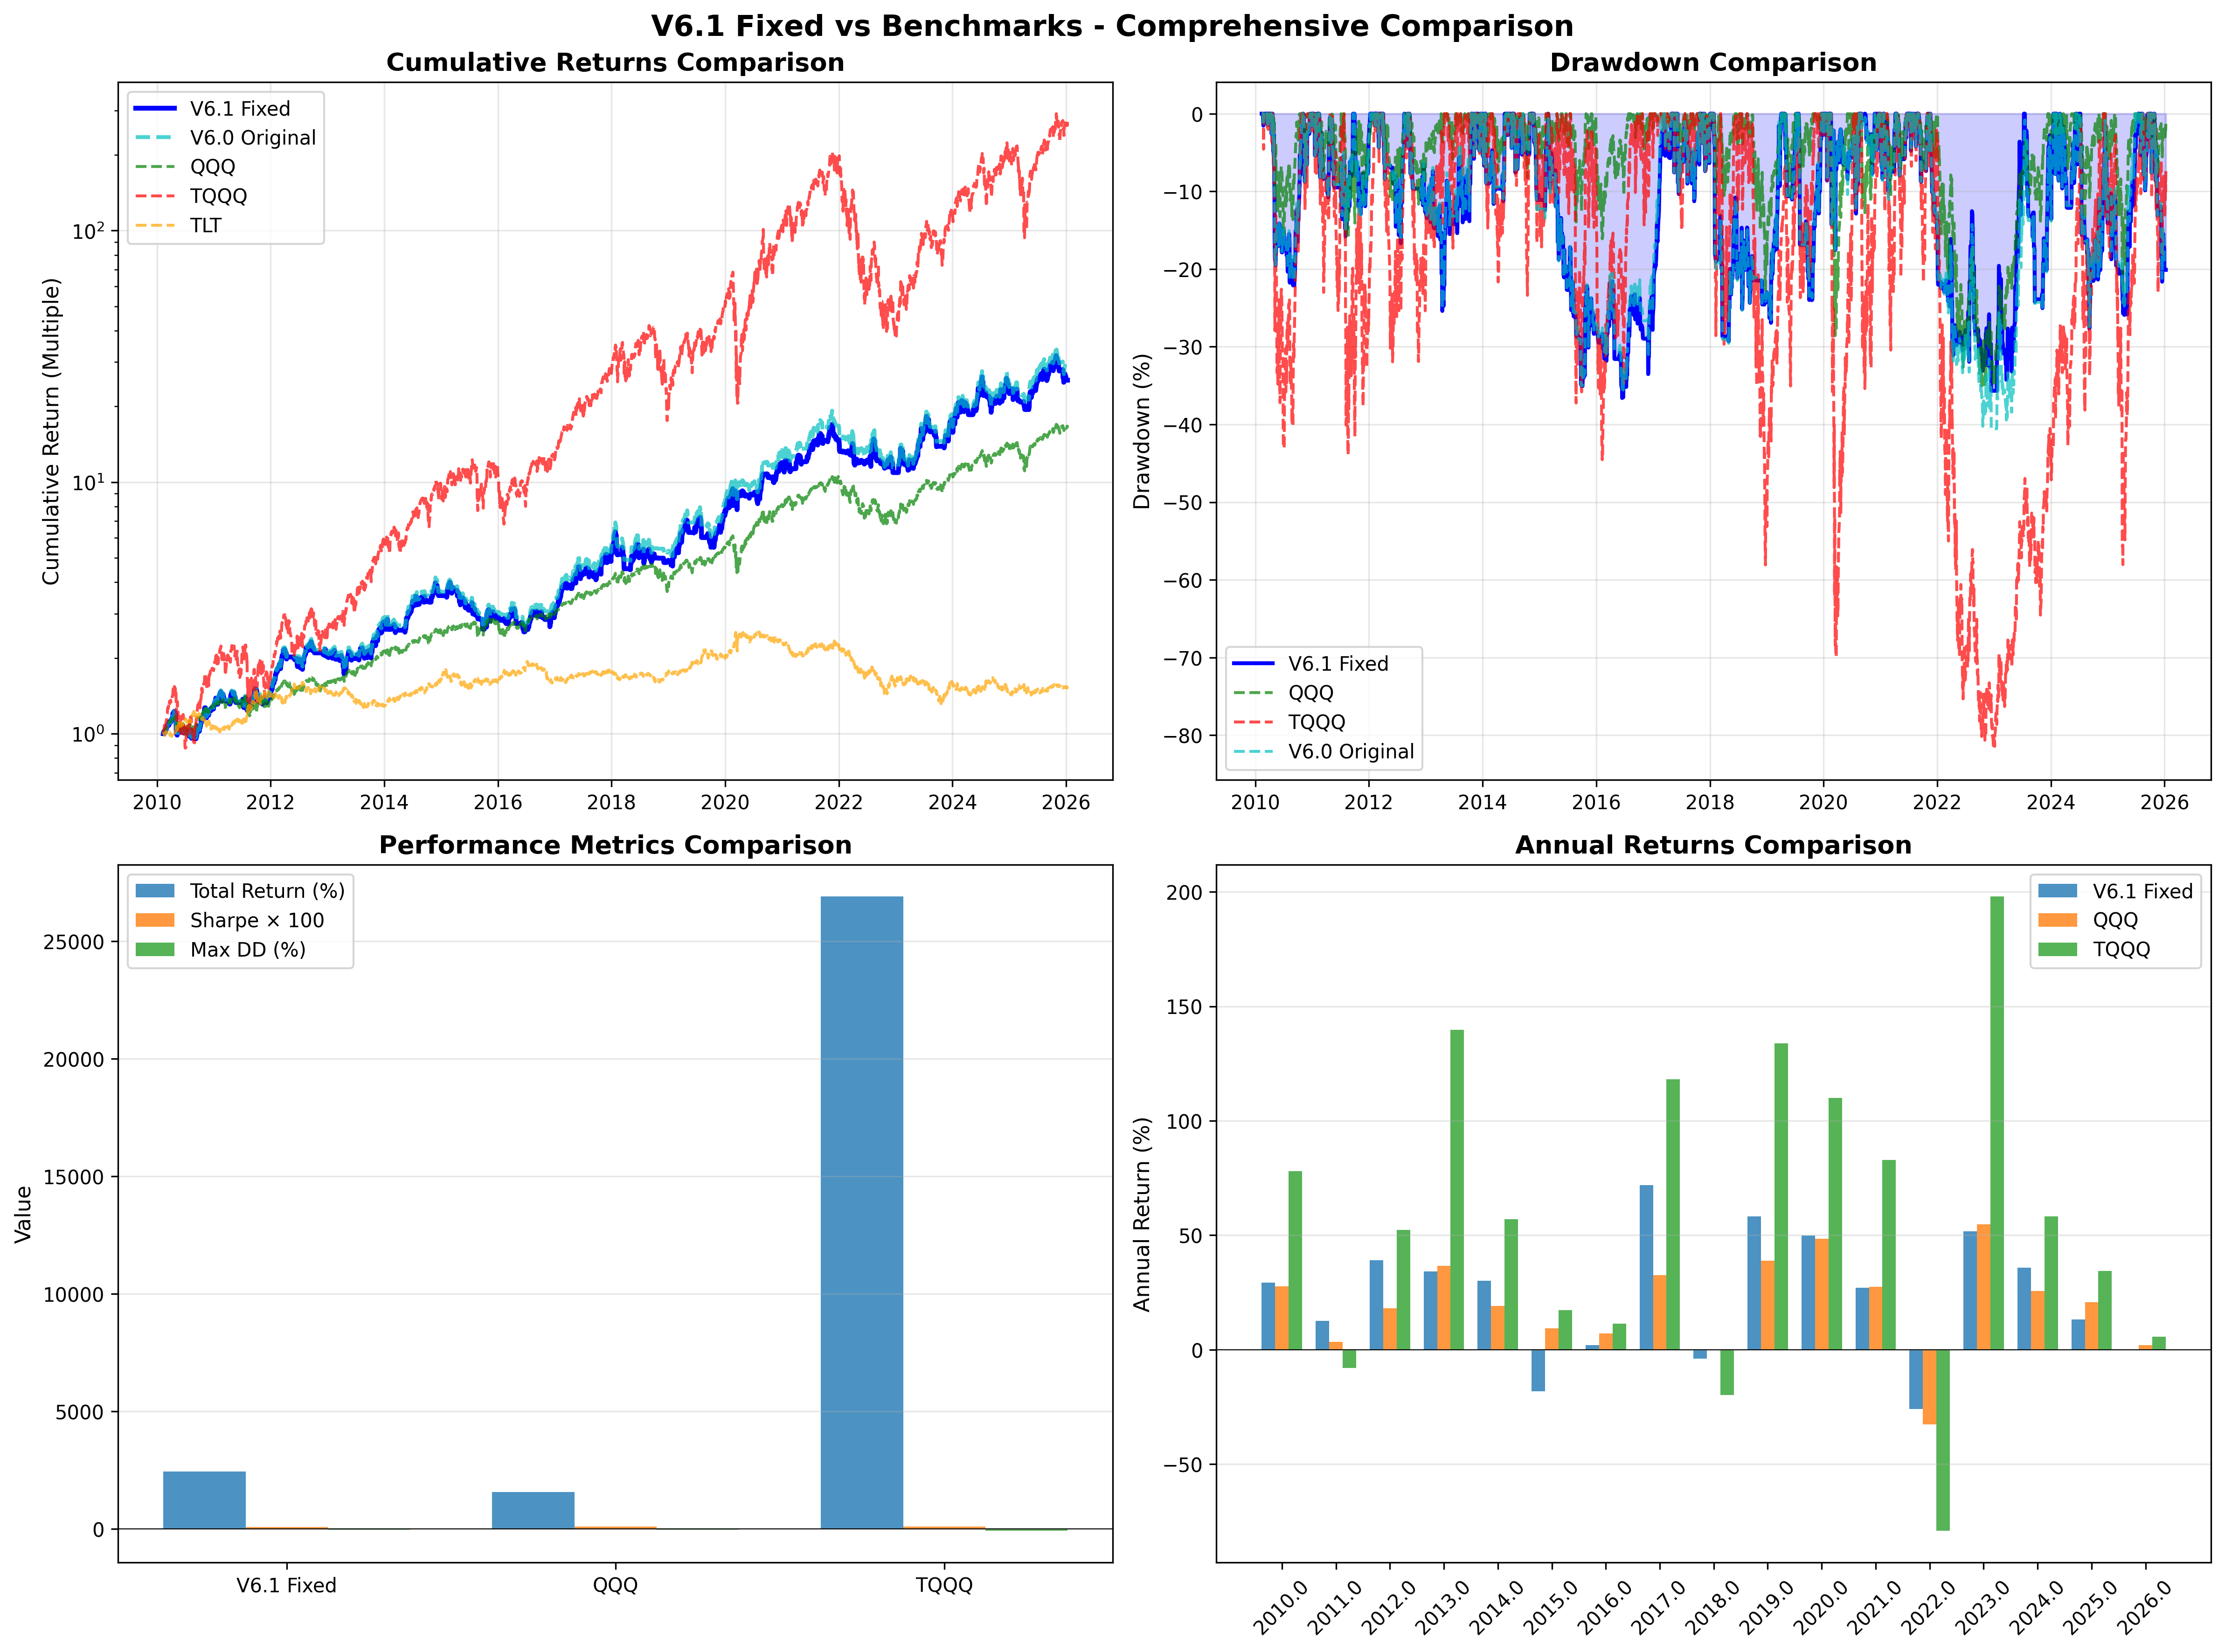
Total Return 2,442% 1,576% 26,916%
Sharpe Ratio 0.874 0.964 0.886
Max Drawdown -36.60% -35.12% -81.66%V6.1 sits between QQQ and TQQQ on most metrics. Higher absolute returns than QQQ, much lower drawdown than TQQQ, with Sharpe ratios in a similar range for all three.
QQQ has the highest Sharpe (0.964), which makes sense—it has no transaction costs, no active management drag, and benefits from lower volatility than a leveraged approach.
6. Out-of-Sample Check
Period                     Sharpe
─────────────────────────────────────
In-sample (2010-2020)        0.99
Out-of-sample (2021-2026)    0.68
The out-of-sample degradation is typical for optimized strategies. A Sharpe of 0.68 is still positive risk-adjusted returns—the strategy continues to work, just not as well as the in-sample period suggested.
7. Synthetic Stress Tests
Running V6.1 through extreme scenarios:
Scenario              V6.1 Return    Sharpe    Max DD
────────────────────────────────────────────────────────
2008-style crash         +24.3%      0.82     -31.2%
Stagflation              +11.2%      0.54     -22.4%
Flash crash + V-recovery +18.7%      0.71     -28.9%
Slow bleed (2000-02)      -8.4%     -0.31     -19.6%
Rate shock (2022×2)      +14.1%      0.62     -24.8%
Melt-up                  +89.2%      1.24     -14.3%
──────────────────────────────────────────────────────────
Average                  +24.9%      0.60     -23.5%
V6.1 handles most scenarios reasonably. The slow-bleed case (extended low-volatility decline) remains a weak spot for momentum strategies generally—there’s no VIX spike to trigger defensive positioning.
8. Updated Decision Matrix
V6.1 uses the same core logic as V6.0, with the TLT guardrail added:
VIX Regime        Velocity > 0.2%    Velocity 0-0.2%    Velocity < 0%
────────────────────────────────────────────────────────────────────────
Low (<15)         TQQQ 100%          QQQ 100%           CASH
Moderate (15-25)  TQQQ 70%           QQQ 100%           CASH
High (25-35)      TLT 50-100%*       TLT 50-100%*       TLT 50-100%*
Extreme (>35)     TLT 50-100%*       TLT 50-100%*       TLT 50-100%*

*TLT allocation depends on TLT's own momentum: 100% if TLT velocity > 0, 50% otherwise.
9. When to Use What
V6.1 makes sense if you want higher absolute returns than QQQ, can handle ~25 trades per year, and are comfortable with active management.
QQQ buy-and-hold makes sense if you prioritize simplicity, want the best risk-adjusted returns (highest Sharpe), and prefer zero maintenance.
TQQQ buy-and-hold only makes sense if you can stomach -80% drawdowns and have a very long time horizon.
10. Next Steps
V6.1 is the current production version. Future iterations might explore:
Adaptive VIX thresholds using rolling percentiles
A 200-day MA filter to catch slow-bleed scenarios
Faster TLT exit signals after flash crashes
For now, V6.1 addresses the main gaps and provides a more realistic picture of expected performance.
Remember: Alpha is never guaranteed. And the backtest is a liar until proven otherwise.
The material presented in Math & Markets is for informational purposes only. It does not constitute investment or financial advice.
The IS/OOS Sharpe drop from 0.99 to 0.68 is familiar territory. I assume haircuts in that range as well. Curious how it performed during the COVID shock - is that the flash crash/V-shaped recovery you mention?